Hello there!
Intro
I run a small homelab based on a Raspberry Pi 5. Initially, I used it as a network-level ad blocker (Pi-hole) and a storage server. Over time, I’ve added some apps, primarily Docker containers. But I didn’t configure any log collection or monitoring. If I need to look at logs, I would log in to the server and use docker logs or open Portainer.
So, I’ve started to research different tools to collect logs. The first thing I have in mind was the ELK stack (Elasticsearch, Logstash, Kibana). They are fine tools, and I have a lot of experience using them to debug services on different environments. But it is quite “heavy”, I’ve tried to deploy an existing “production-ready” Helm chart, and it requires a lot of resources (RAM) to run. So, I’ve decided to look for something else and found Grafana Loki.
Grafana Loki
Grafana Loki is a log aggregation system. It is optimized for storing and querying logs, and is built to be cost-effective, easy to operate, and highly scalable:
Loki is a horizontally scalable, highly available, multi-tenant log aggregation system inspired by Prometheus. It’s designed to be very cost-effective and easy to operate. It doesn’t index the contents of the logs, but rather a set of labels for each log stream.
It’s quite easy to setup. In my case, you just need to start a single Docker container, no need to create a cluster and most importantly it will consume a small fraction of RAM, and it could be easily integrated with other Grafana’s services. I wanted to try to setup Loki for a long time but because the current approach worked well, I postponed this idea.
Also, there is a Docker plugin to automatically collect Docker logs and send them to the Loki server. So, recently I’ve tried to set up Loki and a plugin and faced “epic fail”. The setup and configuration are pretty simple, but I forgot about one important point. I’ve deployed Loki as a container and configured Docker to point at this container. So, when Docker starts and loads the Loki plugin, it can’t connect to the Loki container because it is not there yet. So, the entire Docker service crashes. If you want to use the Loki plugin, you need to deploy your Loki server outside the current Docker, for example, install it directly on the server or on another machine.
I prefer to deploy everything as Docker containers, if possible. I’ve decided to stick with a container and abandon the idea of using plugin. So, I needed to find something else.
Grafana Alloy
Recently, I found out about Grafana Alloy - a tool to collect logs or metrics, and send them to Loki or Prometheus:
Grafana Alloy combines the strengths of the leading collectors into one place. Whether observing applications, infrastructure, or both, Grafana Alloy can collect, process, and export telemetry signals to scale and future-proof your observability approach.
It’s a new app, designed to replace the deprecated Promtail:
Promtail is now deprecated and will enter into Long-Term Support (LTS) beginning Feb. 13, 2025.
Alloy has several important features for me:
- collect logs from Docker containers
- collect logs from the file system
- collect metric
- automatic discovery
- simple configuration
Let’s look at a sample configuration. It discovers Docker containers, reads and processes logs, and sends them to Loki.
discovery.docker "default" {
  host = "unix:///var/run/docker.sock"
}

discovery.relabel "docker_relabel" {
  targets = discovery.docker.default.targets

  rule {
    action = "labelmap"
    regex  = "__meta_docker_(.*)"
  }

  rule {
    action        = "replace"
    source_labels = ["container_name"]
    target_label  = "container_name"
    regex         = "/(.*)"
  }
}

discovery.relabel "keep_logs" {
  targets = discovery.relabel.docker_relabel.output

  rule {
    action        = "keep"
    source_labels = ["container_label_collect_logs"]
    regex         = "true"
  }
}

loki.source.docker "default" {
  host          = "unix:///var/run/docker.sock"
  targets       = discovery.relabel.keep_logs.output
  labels        = {"platform" = "docker"}
  forward_to    = [loki.process.app_logs_parser.receiver]
}

loki.process "app_logs_parser" {
  stage.match {
    pipeline_name = "alloy"
    selector      = "{container_name=\"alloy\"}"

    stage.drop {
      // ...
    }

    stage.logfmt {
      mapping = {
        // ...
      }
    }

    stage.labels {
      values = {
        // ...
      }
    }

    stage.timestamp {
      // ...
    }

    stage.structured_metadata {
      values = {
        // ...
      }
    }

    stage.template {
      // ...
    }

    stage.output {
      source = "output"
    }
  }

  forward_to = [loki.write.default.receiver]
}

loki.write "default" {
  endpoint {
    url = "http://loki:3100/loki/api/v1/push"
  }
}
The Alloy configuration consist of block, where each block has a name, is responsible for some action, and has its own inputs and outputs.
Blocks from the example:
discovery.dockerconfigures a connection toDockerand discovers containers. Containers are returned in thetargetsproperty - an array of labels. For example:__meta_docker_container_name = "/alloy"discovery.relabelallows us to modify labels to make them look better, to simplify the next stages, or add/remove them. Each such modification is described as a rule. For example:rule { action = "labelmap" regex = "__meta_docker_(.*)" }, it drops the__meta_docker_prefix from labels. So, we can usecontainer_nameinstead of__meta_docker_container_name. Also, I’m usingdiscovery.relabelto filter out containers based on thecollect_logs=truelabel, where I don’t want to collect logs.loki.source.dockercollects logs from containers selected indiscovery.relabeland sends them to the next step.loki.processallows us to process (parse) logs, each step is defined as a stage. Each container has its own log format. So, we can’t send them to Loki right away. I’m using this step tostage.matchto match logs for specific container.stage.logfmtorstage.expressionto parse a log entry to labels.stage.labelsandstage.structured_metadatato map labels.stage.timestampto defined format of a timestamp and parse it.stage.templateandstage.outputto defined output format.loki.writeconfigures a connection toLoki.
So, as you can see, the configuration is pretty simple. And you can do the same thing for metrics. Discover containers with specific labels, collect metrics, and send them to Prometheus. Alloy has a lot of different blocks and configuration options, so it’s better to refer to the documentation.
Alloy has a web UI and a live debugging feature. You can enable UI by --server.http.listen-addr=0.0.0.0:12345 command line argument. Live debugging can be enabled in the configuration:
livedebugging {
  enabled = true
}
The UI allows you to see your entire configuration as a graph. Here is my graph:
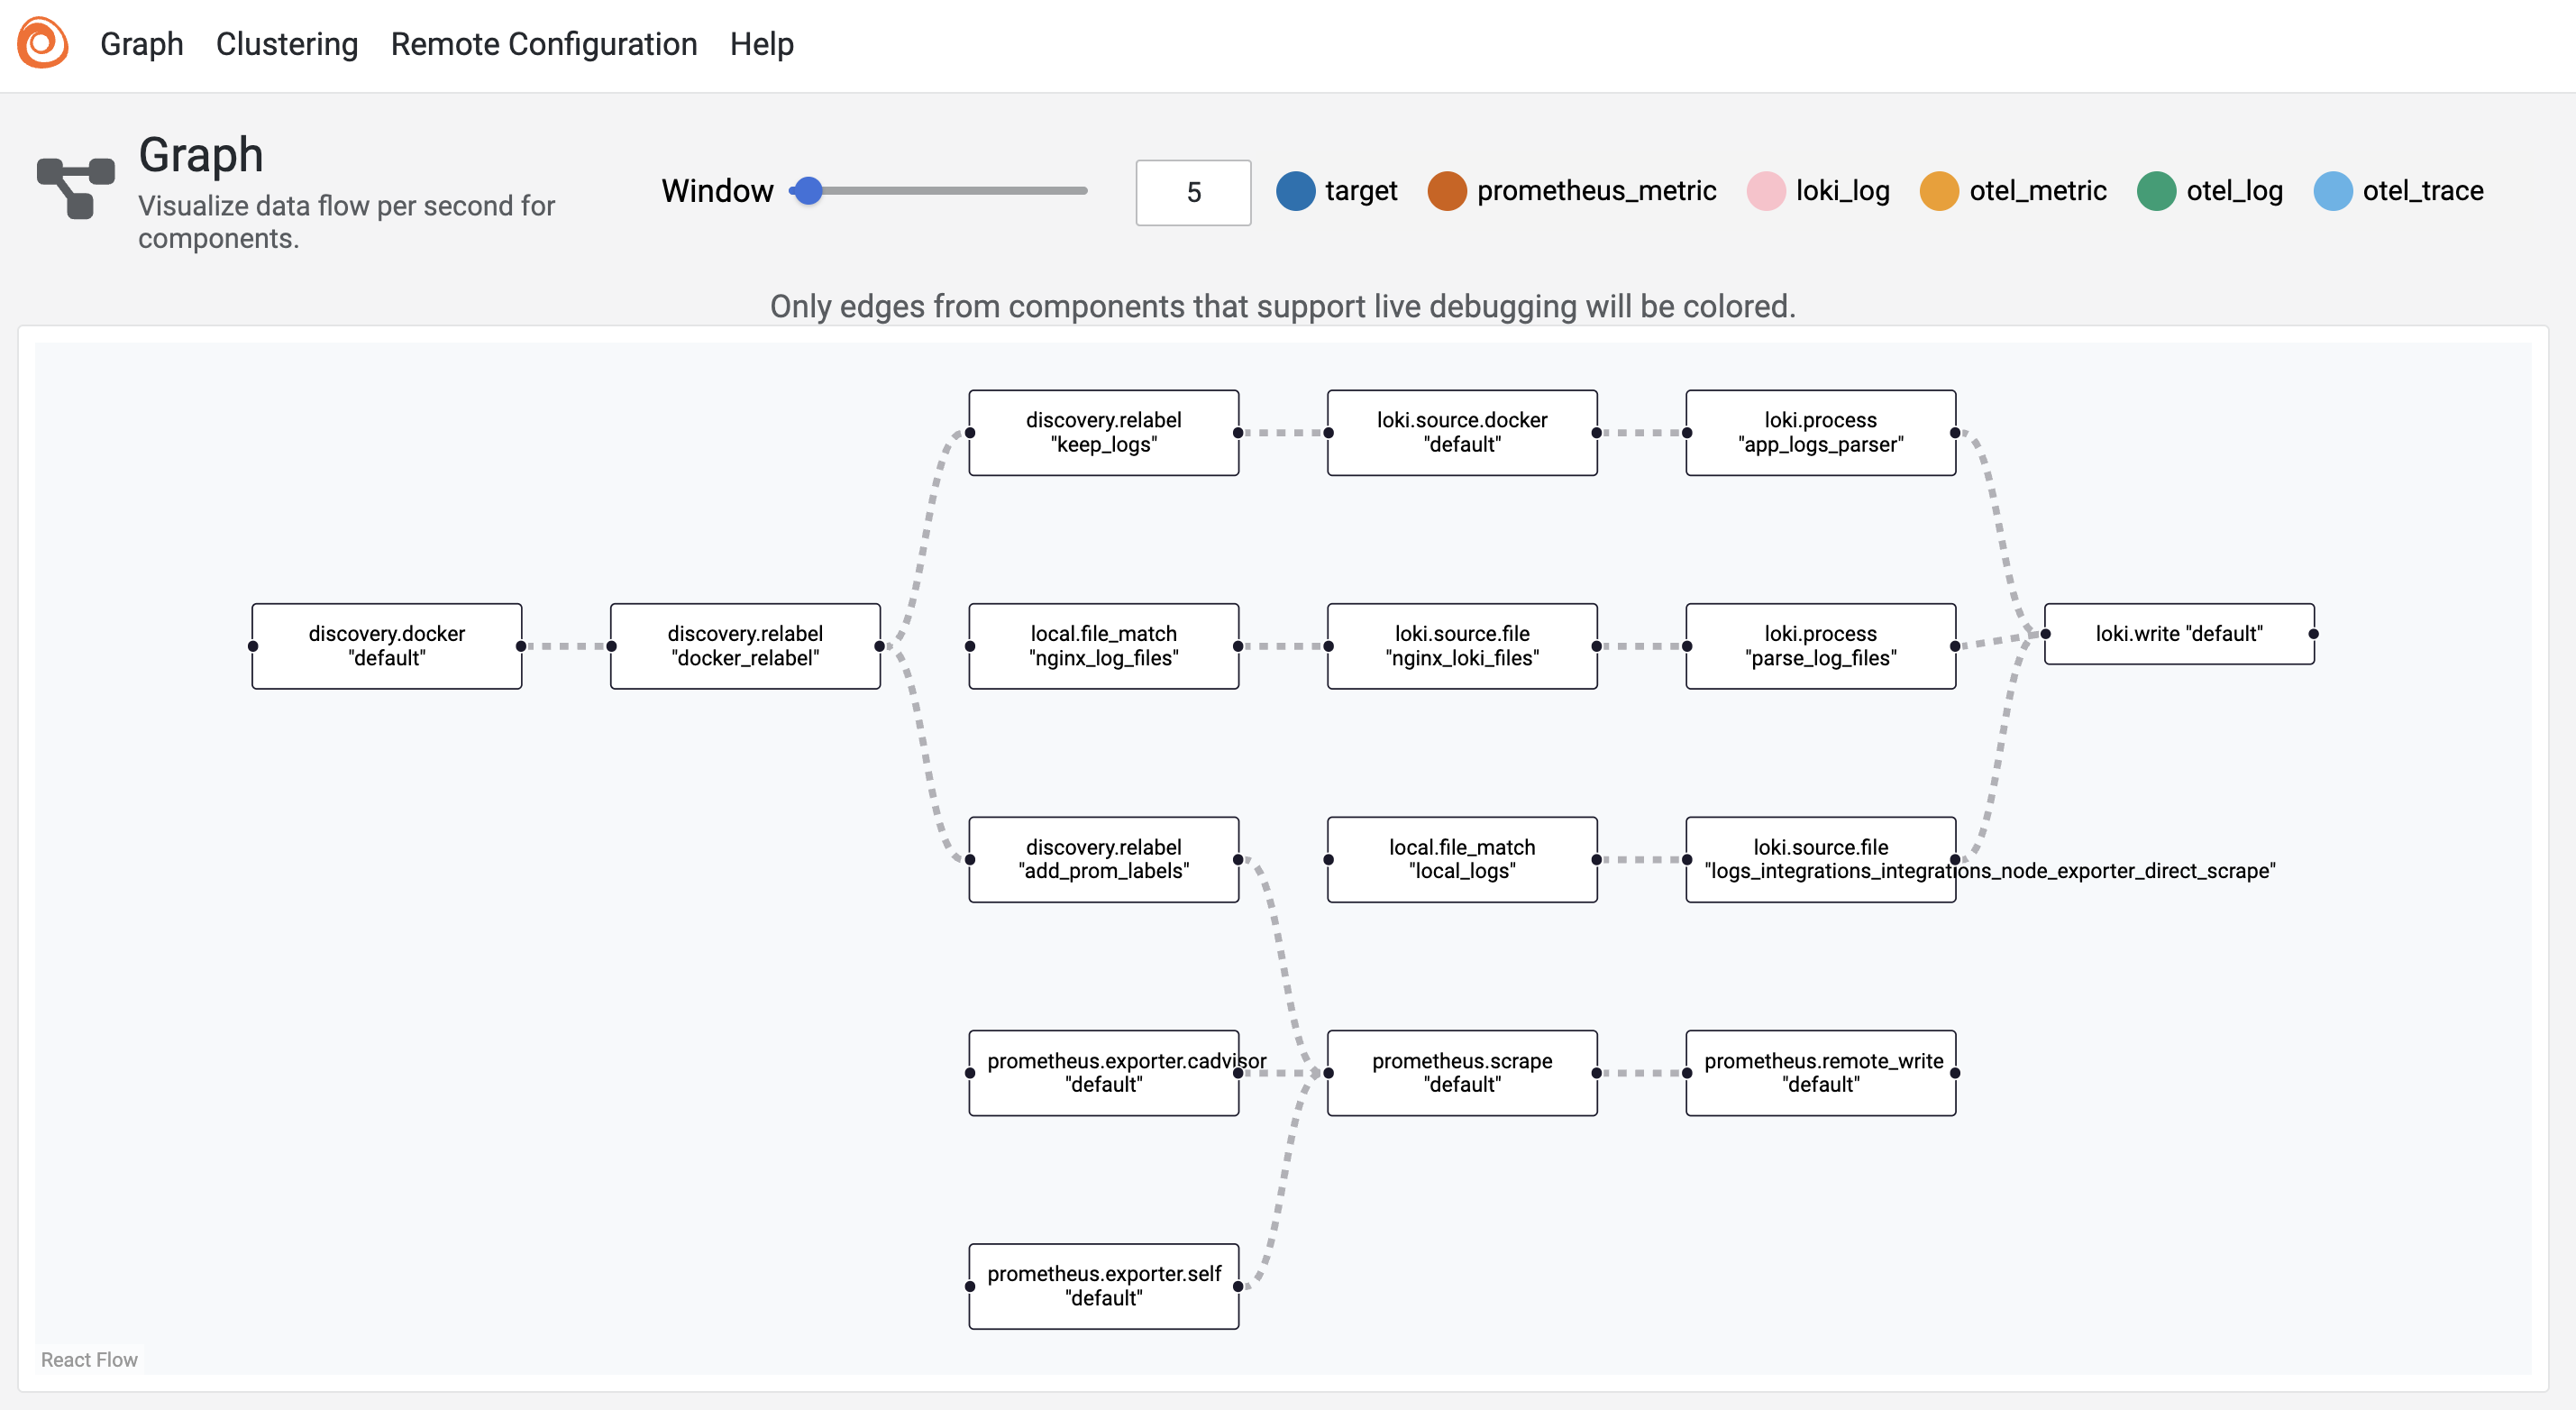
You can click on any node and see input, output, and configuration parameters, but most importantly, you can see what data is coming into the node and what’s coming out. For example, here is the output from discovery.relabel:
{
    "__address__"="172.27.0.9:3000",
    "__meta_docker_container_id"="e539fa278abfa75cfe4a21315cb28602148ee9330fd2084b809d6cf15f69b4c7",
    "__meta_docker_container_label_collect_logs"="true",
    "__meta_docker_container_label_com_docker_compose_config_hash"="8a2245b0a449b8a16ff22995b1cea7857d2611d715d6d15046c05e7bf707dd13",
    "__meta_docker_container_label_com_docker_compose_container_number"="1",
    "__meta_docker_container_label_com_docker_compose_image"="sha256:4b30e14267ee4bd0044d909cbdfac7c1a7c0d8f5c6abdae5bccffe16910d9f3b",
    "__meta_docker_container_label_com_docker_compose_oneoff"="False",
    "__meta_docker_container_label_com_docker_compose_project"="monitoring",
    "__meta_docker_container_label_com_docker_compose_service"="grafana",
    "__meta_docker_container_label_com_docker_compose_version"="2.39.1",
    "__meta_docker_container_label_maintainer"="Grafana Labs <hello@grafana.com>",
    "__meta_docker_container_label_org_opencontainers_image_source"="https://github.com/grafana/grafana",
    "__meta_docker_container_name"="/grafana",
    "__meta_docker_container_network_mode"="monitoring_default",
    "__meta_docker_network_id"="441b6ce969803aca3a12f01b1db9267e6b7770ad1ca61d4aac96028698c78de5",
    "__meta_docker_network_ingress"="false",
    "__meta_docker_network_internal"="false",
    "__meta_docker_network_ip"="172.27.0.9",
    "__meta_docker_network_name"="frontend",
    "__meta_docker_network_scope"="local",
    "__meta_docker_port_private"="3000"
} => {
    "__address__"="172.27.0.9:3000",
    "__meta_docker_container_id"="e539fa278abfa75cfe4a21315cb28602148ee9330fd2084b809d6cf15f69b4c7",
    "__meta_docker_container_label_collect_logs"="true",
    "__meta_docker_container_label_com_docker_compose_config_hash"="8a2245b0a449b8a16ff22995b1cea7857d2611d715d6d15046c05e7bf707dd13",
    "__meta_docker_container_label_com_docker_compose_container_number"="1",
    "__meta_docker_container_label_com_docker_compose_image"="sha256:4b30e14267ee4bd0044d909cbdfac7c1a7c0d8f5c6abdae5bccffe16910d9f3b",
    "__meta_docker_container_label_com_docker_compose_oneoff"="False",
    "__meta_docker_container_label_com_docker_compose_project"="monitoring",
    "__meta_docker_container_label_com_docker_compose_service"="grafana",
    "__meta_docker_container_label_com_docker_compose_version"="2.39.1",
    "__meta_docker_container_label_maintainer"="Grafana Labs <hello@grafana.com>",
    "__meta_docker_container_label_org_opencontainers_image_source"="https://github.com/grafana/grafana",
    "__meta_docker_container_name"="/grafana",
    "__meta_docker_container_network_mode"="monitoring_default",
    "__meta_docker_network_id"="441b6ce969803aca3a12f01b1db9267e6b7770ad1ca61d4aac96028698c78de5",
    "__meta_docker_network_ingress"="false",
    "__meta_docker_network_internal"="false",
    "__meta_docker_network_ip"="172.27.0.9",
    "__meta_docker_network_name"="frontend",
    "__meta_docker_network_scope"="local",
    "__meta_docker_port_private"="3000",
    "container_id"="e539fa278abfa75cfe4a21315cb28602148ee9330fd2084b809d6cf15f69b4c7",
    "container_label_collect_logs"="true",
    "container_label_com_docker_compose_config_hash"="8a2245b0a449b8a16ff22995b1cea7857d2611d715d6d15046c05e7bf707dd13",
    "container_label_com_docker_compose_container_number"="1",
    "container_label_com_docker_compose_image"="sha256:4b30e14267ee4bd0044d909cbdfac7c1a7c0d8f5c6abdae5bccffe16910d9f3b",
    "container_label_com_docker_compose_oneoff"="False",
    "container_label_com_docker_compose_project"="monitoring",
    "container_label_com_docker_compose_service"="grafana",
    "container_label_com_docker_compose_version"="2.39.1",
    "container_label_maintainer"="Grafana Labs <hello@grafana.com>",
    "container_label_org_opencontainers_image_source"="https://github.com/grafana/grafana",
    "container_name"="grafana",
    "container_network_mode"="monitoring_default",
    "network_id"="441b6ce969803aca3a12f01b1db9267e6b7770ad1ca61d4aac96028698c78de5",
    "network_ingress"="false",
    "network_internal"="false",
    "network_ip"="172.27.0.9",
    "network_name"="frontend",
    "network_scope"="local",
    "port_private"="3000"
}
Conclusion
Setting up observability on a low-resource device like a Raspberry Pi doesn’t mean you have to compromise on features. Grafana Alloy offers a modern, lightweight alternative that supports logs and metrics, automatic discovery, has easy configuration, and integrates seamlessly with Grafana and Loki.
The initial idea was to find lightweight alternaive to ELK. Let’s check the actual memory usage. Alloy ~ 500 MB. Loki ~ 250 MB. So, it wouldn’t affect other service on my Raspberry Pi 5 8 GB.